Comprehensive Guide to Creating and Analyzing Digital Cards in BizTapID
15 mins read · Updated 01 Oct, 2025
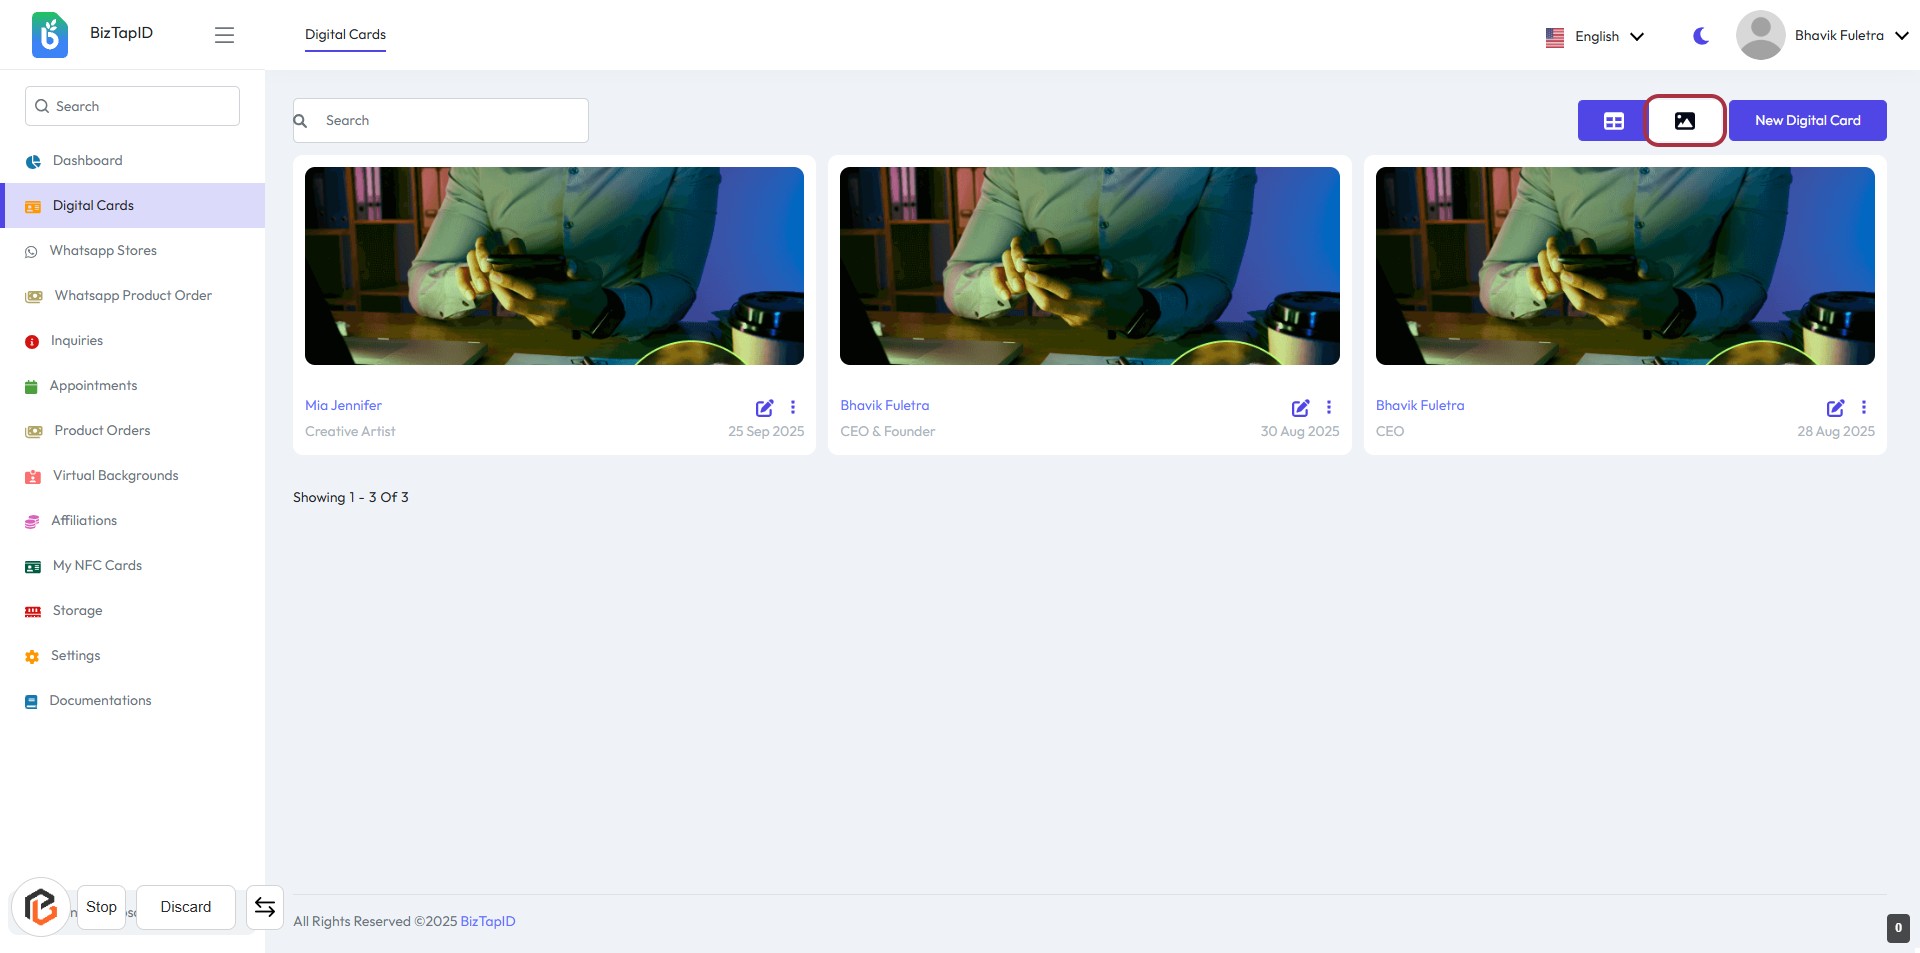
STEP 1: Click "New Digital Card" to Create a Digital Card
- Navigate to the BizTapID dashboard.
- Locate the highlighted button labeled "New Digital Card" in the interface.
- Click on this button to initiate the process of creating a new digital card.
- Ensure all required fields are filled out in the subsequent form to proceed.
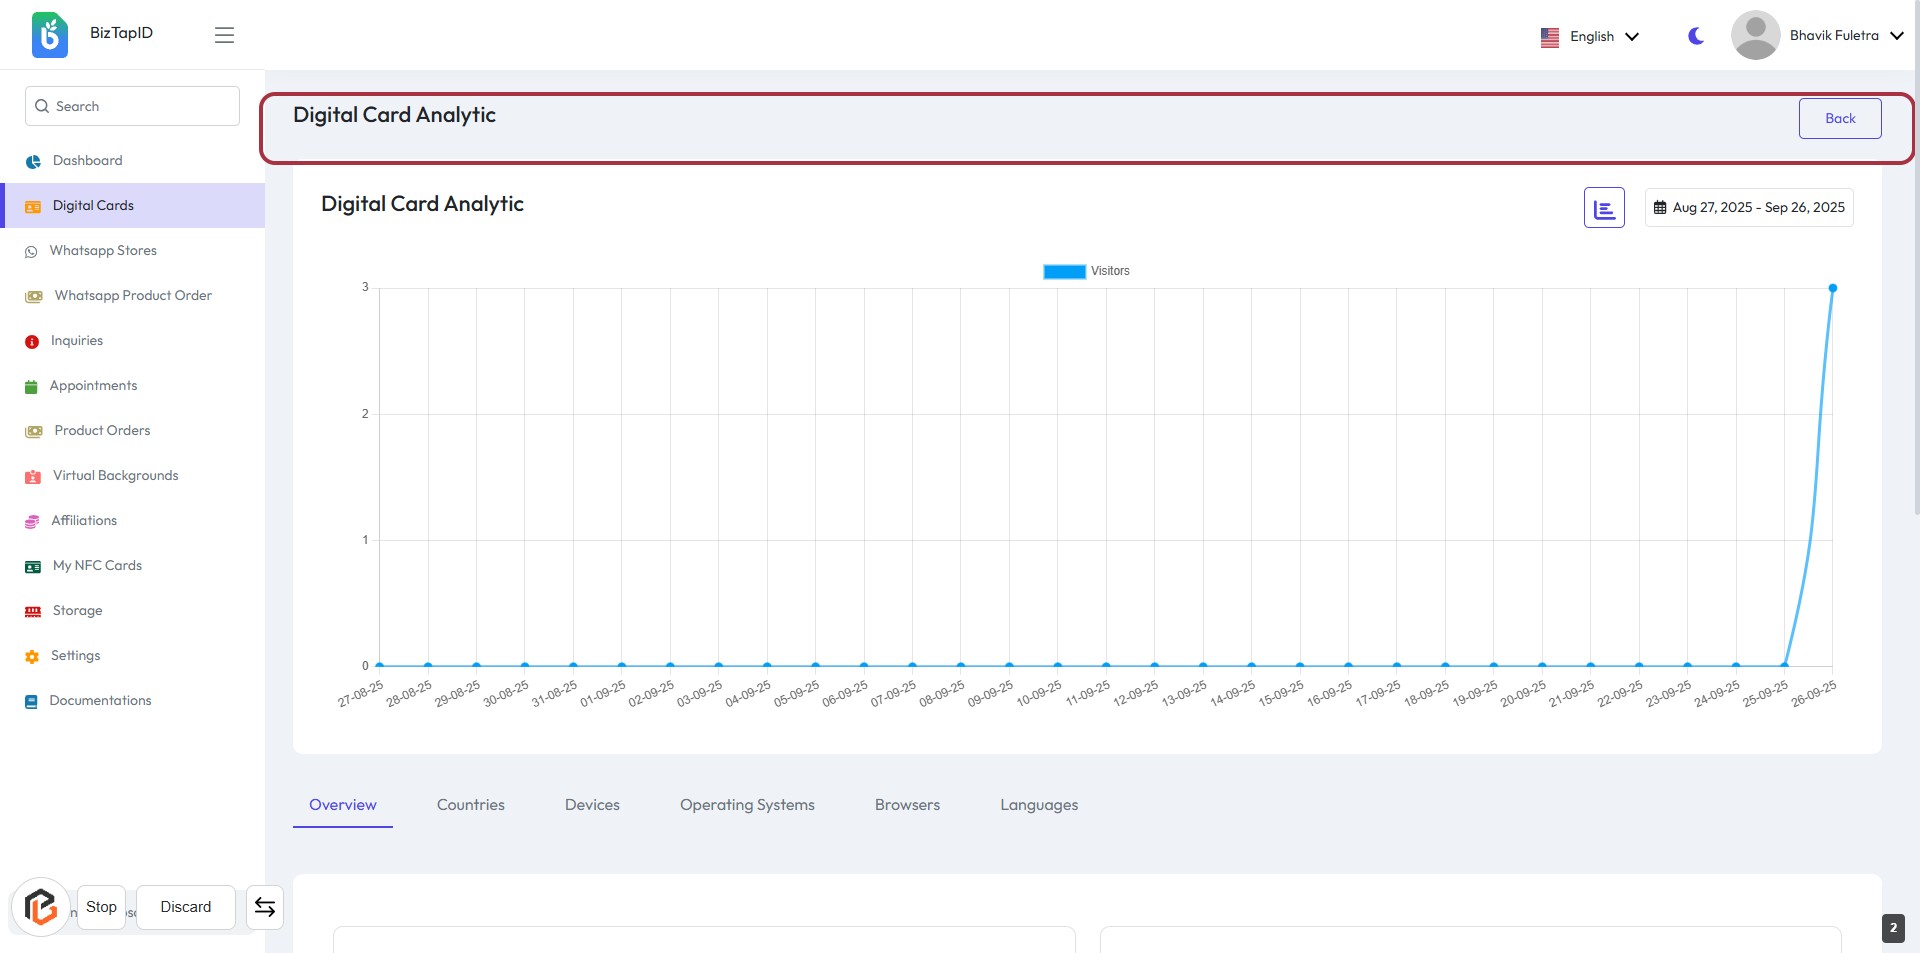
STEP 2: Fill Out the Digital Card Analytics Input
- Navigate to the Digital Card Analytics page.
- Locate the input field highlighted in red.
- Fill out the required information in the input box.
- Ensure to check for any labels marked with an asterisk (*) for mandatory fields.
- Review your entries before proceeding to the next step.
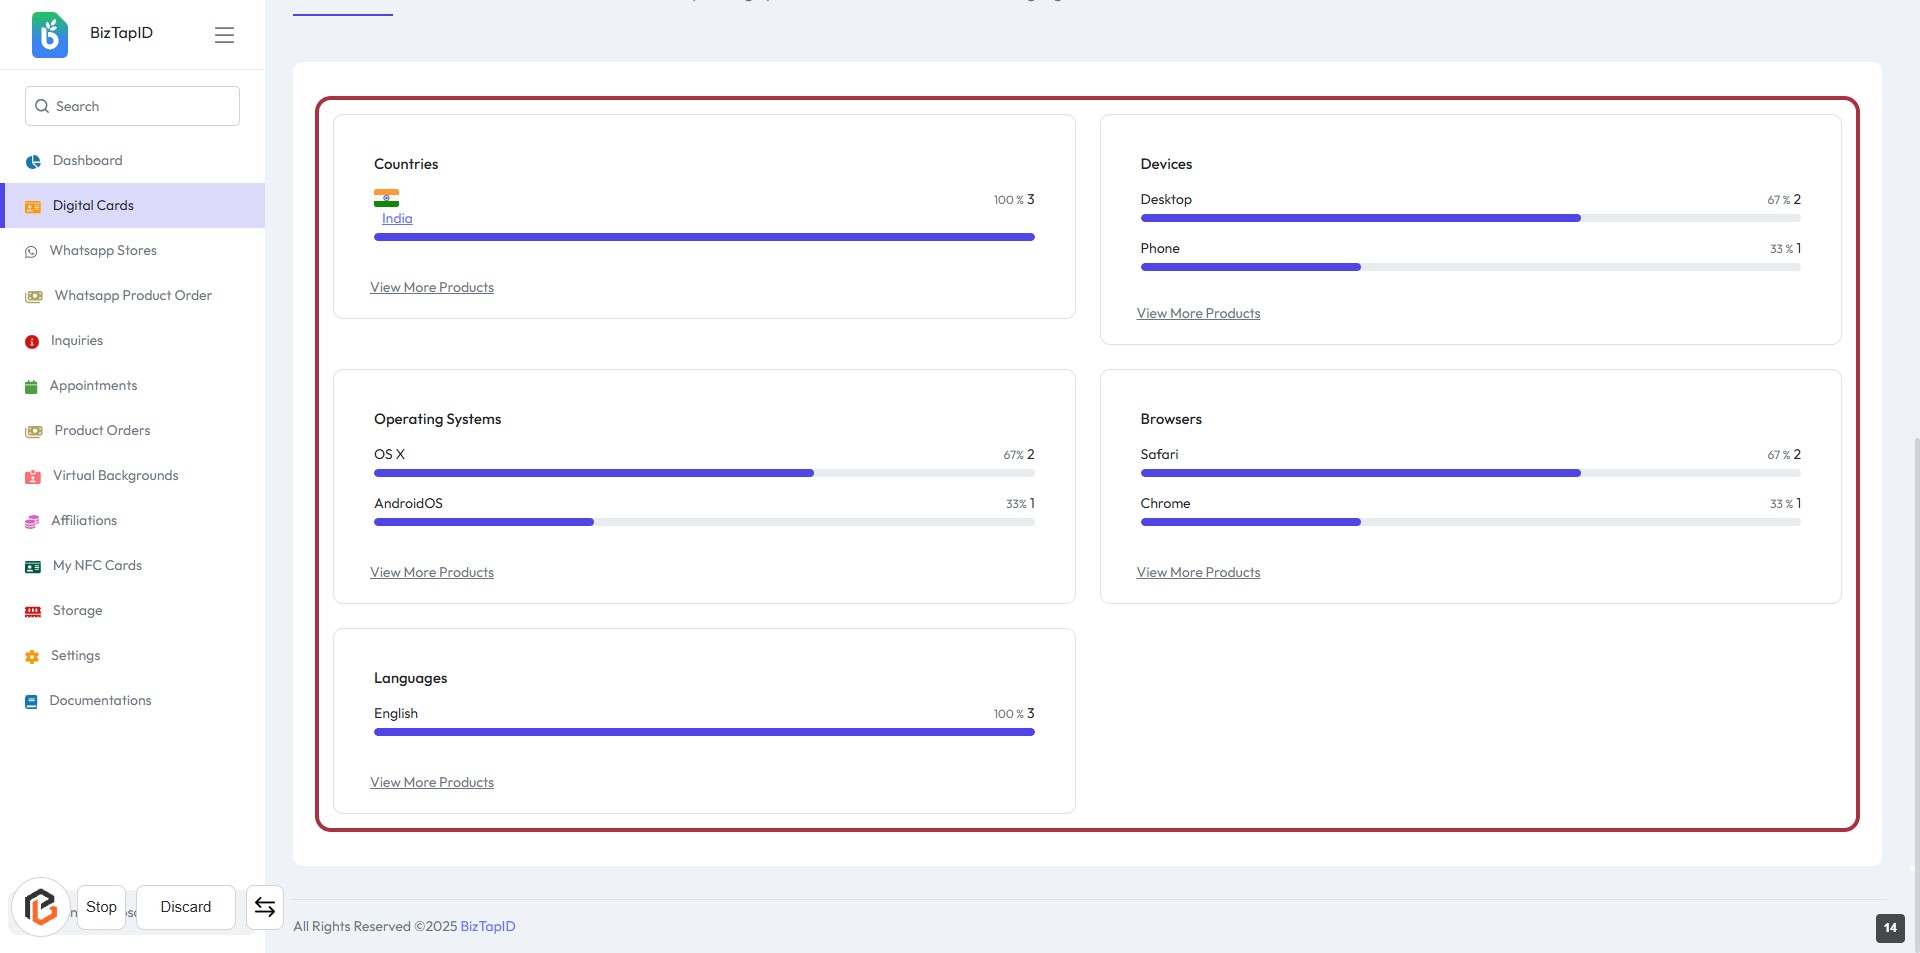
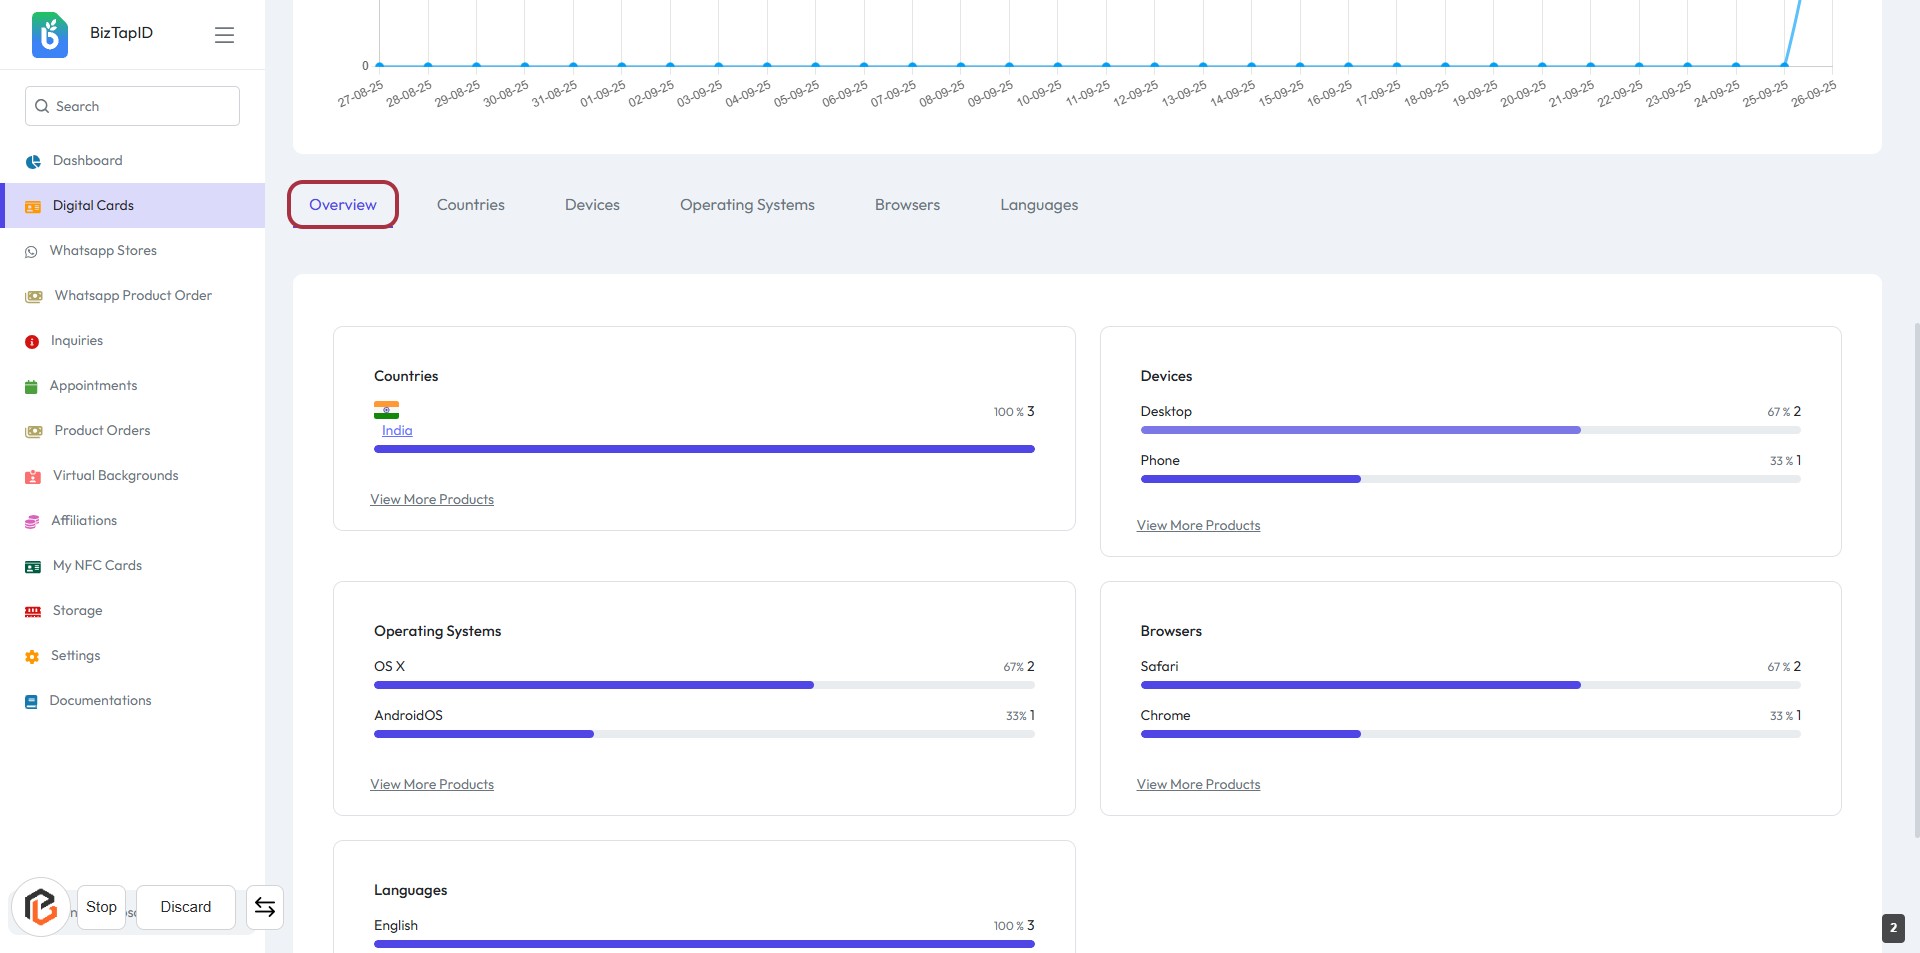
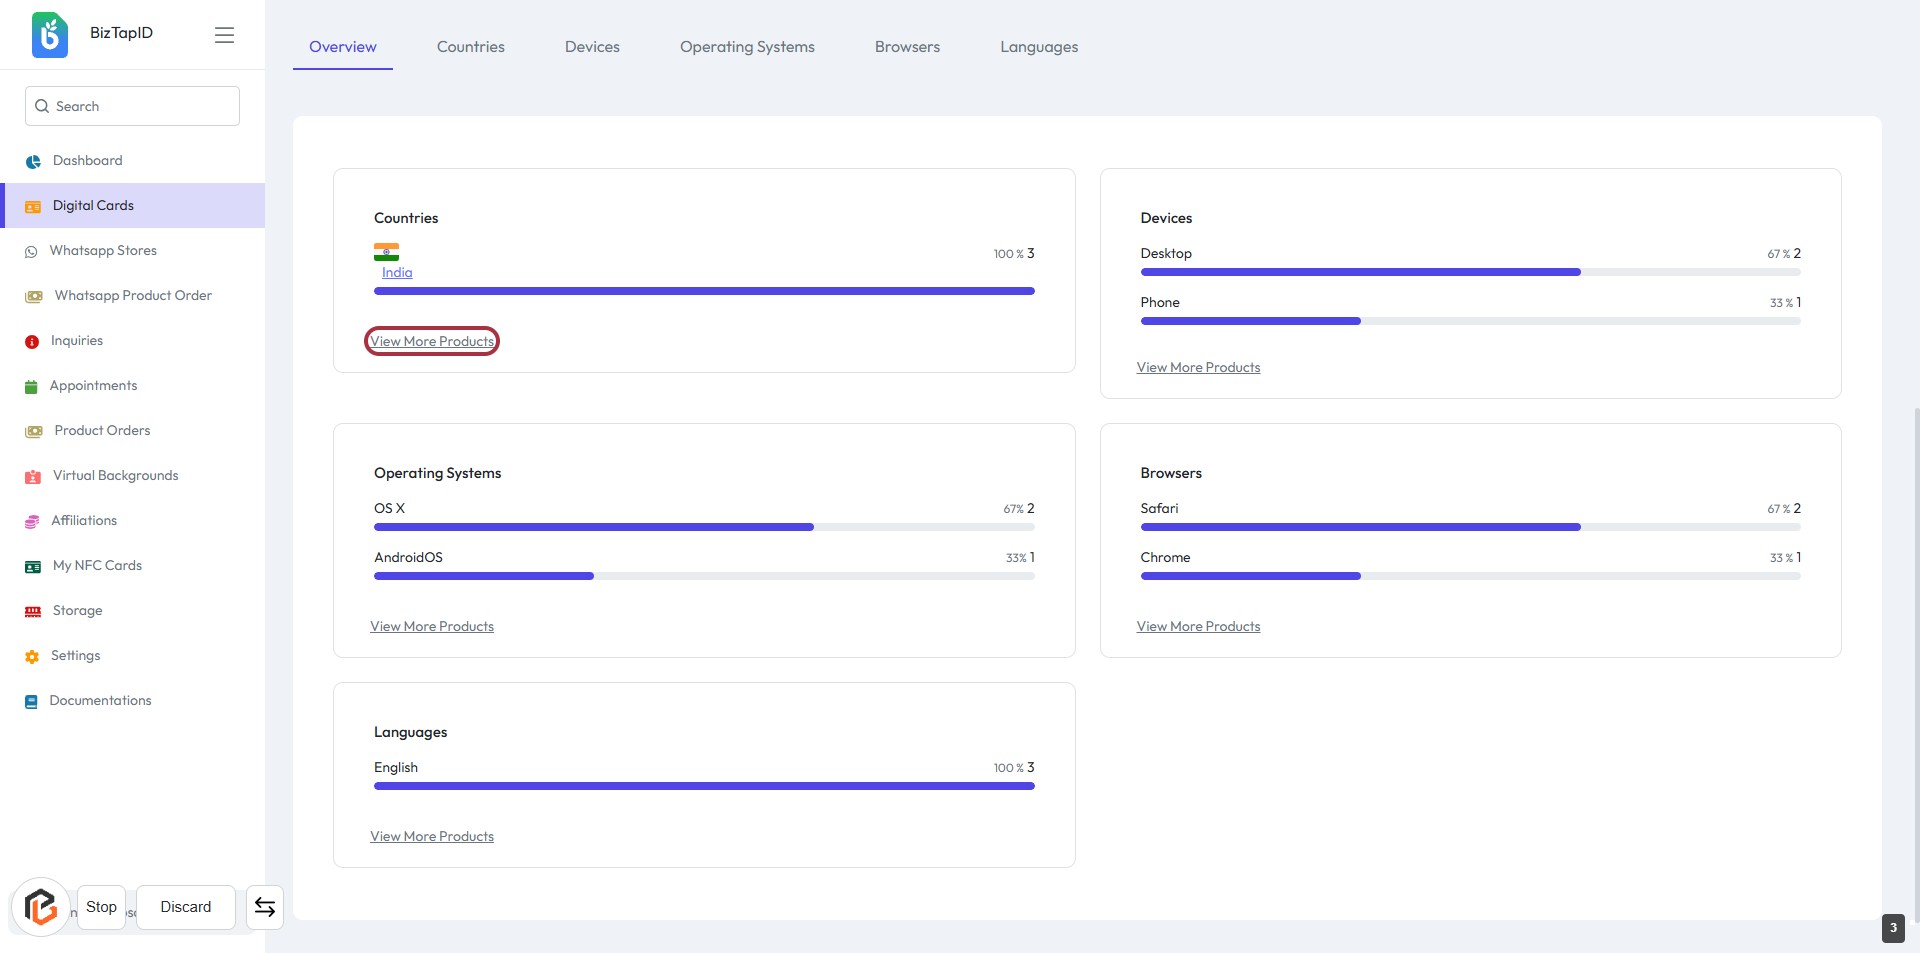
STEP 3: Click on "Overview"
- Navigate to the "Digital Cards" section.
- Click on the "Overview" link to access analytics.
- Review the displayed data on countries, devices, operating systems, browsers, and languages.
- Ensure to check the highlighted areas for specific insights.
- Proceed to the next step by clicking on "View More Products" for additional details.
STEP 4: Click on "View More Products"
- Navigate to the highlighted area labeled "View More Products."
- Click on the link to explore additional products related to the displayed categories.
- Ensure you review any optional inputs or selections that may appear after clicking.
- This action will provide further insights into the products available for each category.
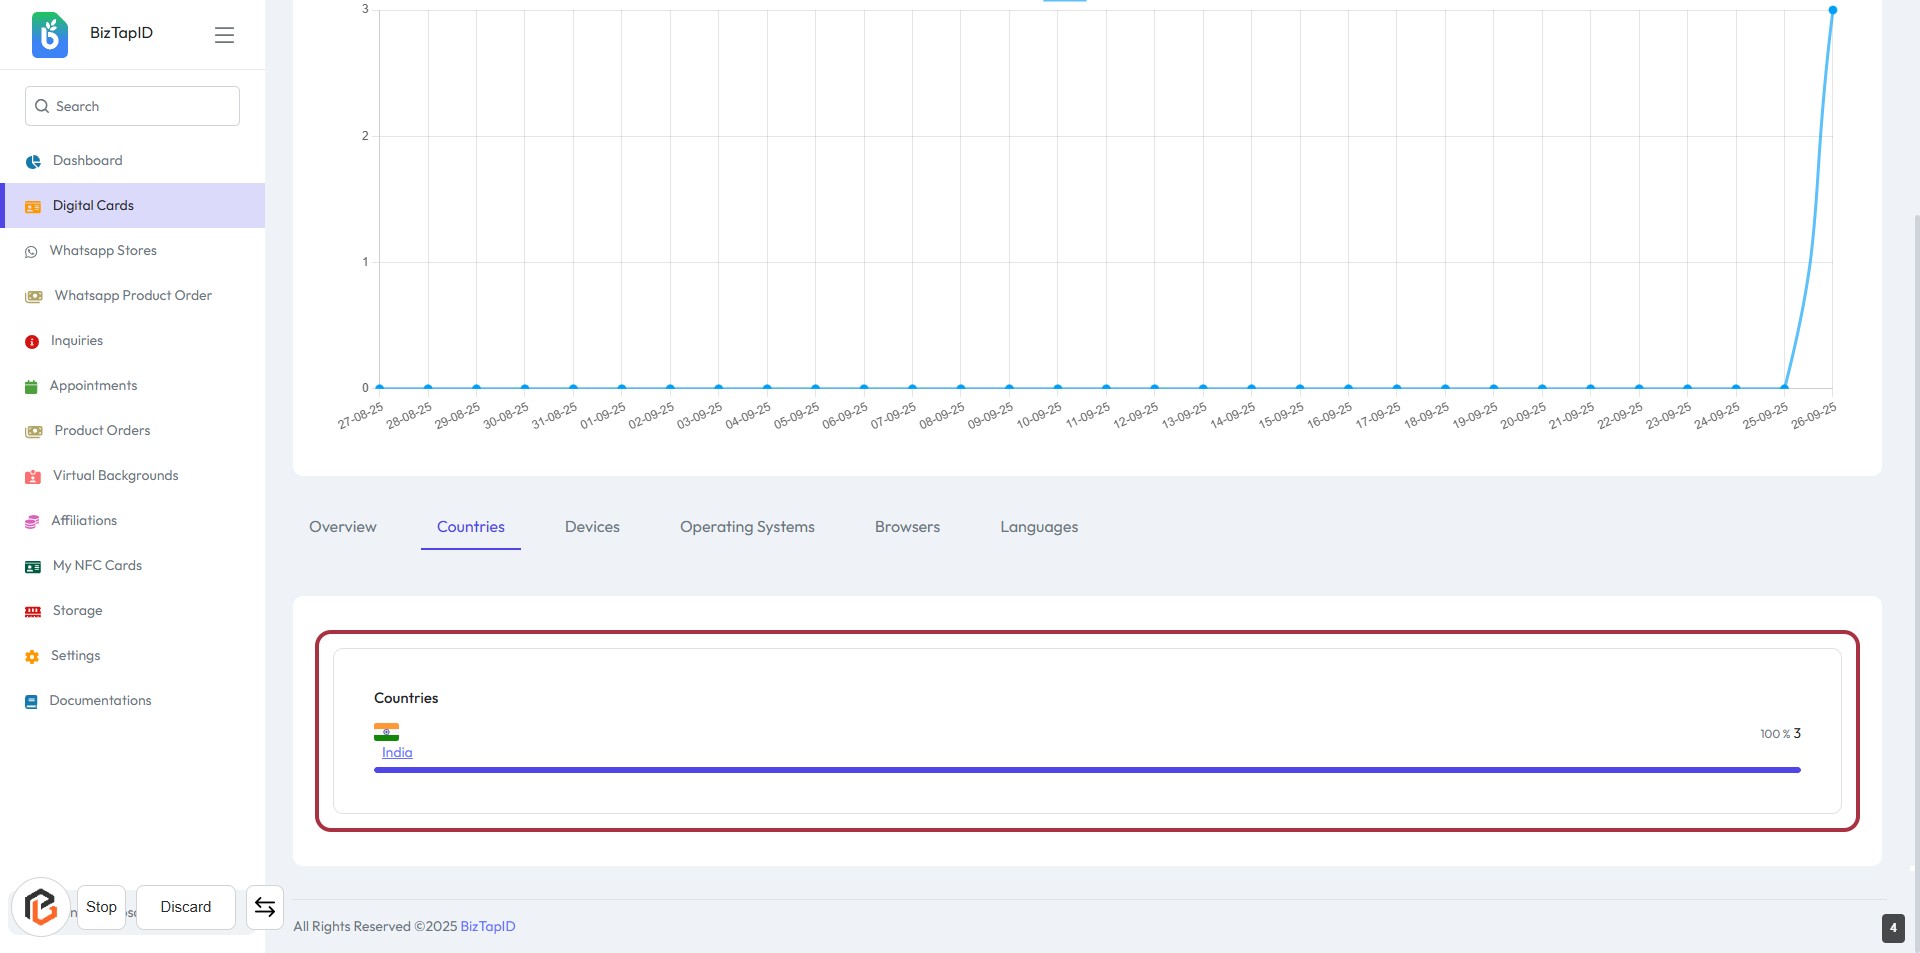
STEP 5: Click on "Countries" to View Analytics
- Click on the highlighted area labeled "Countries" to access detailed analytics.
- Review the displayed data related to countries.
- Ensure to check for any additional information or metrics available in this section.
- After reviewing, proceed to the next step by clicking on "Devices."
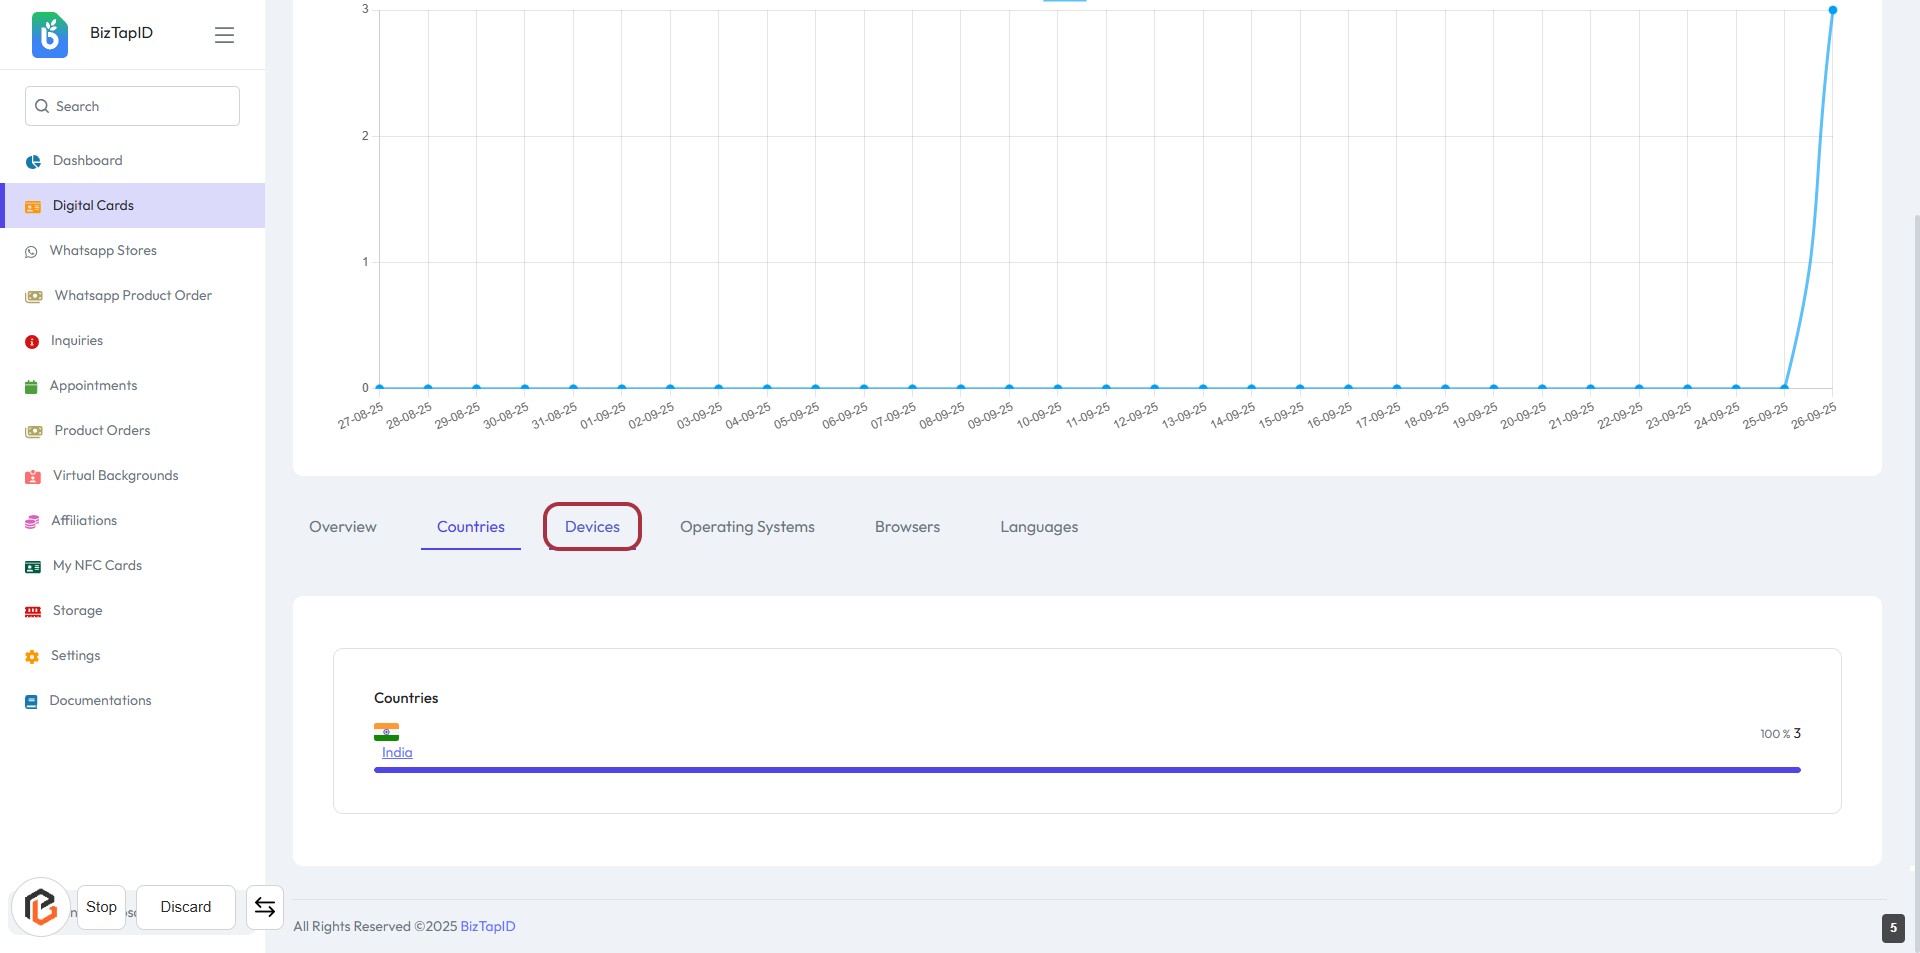
STEP 6: Click on "Devices" to View Device Analytics
- Navigate to the "Devices" tab highlighted in red.
- Click on the "Devices" link to access detailed analytics.
- Review the displayed data related to device usage.
- Ensure you have completed the previous step by viewing "Countries" analytics.
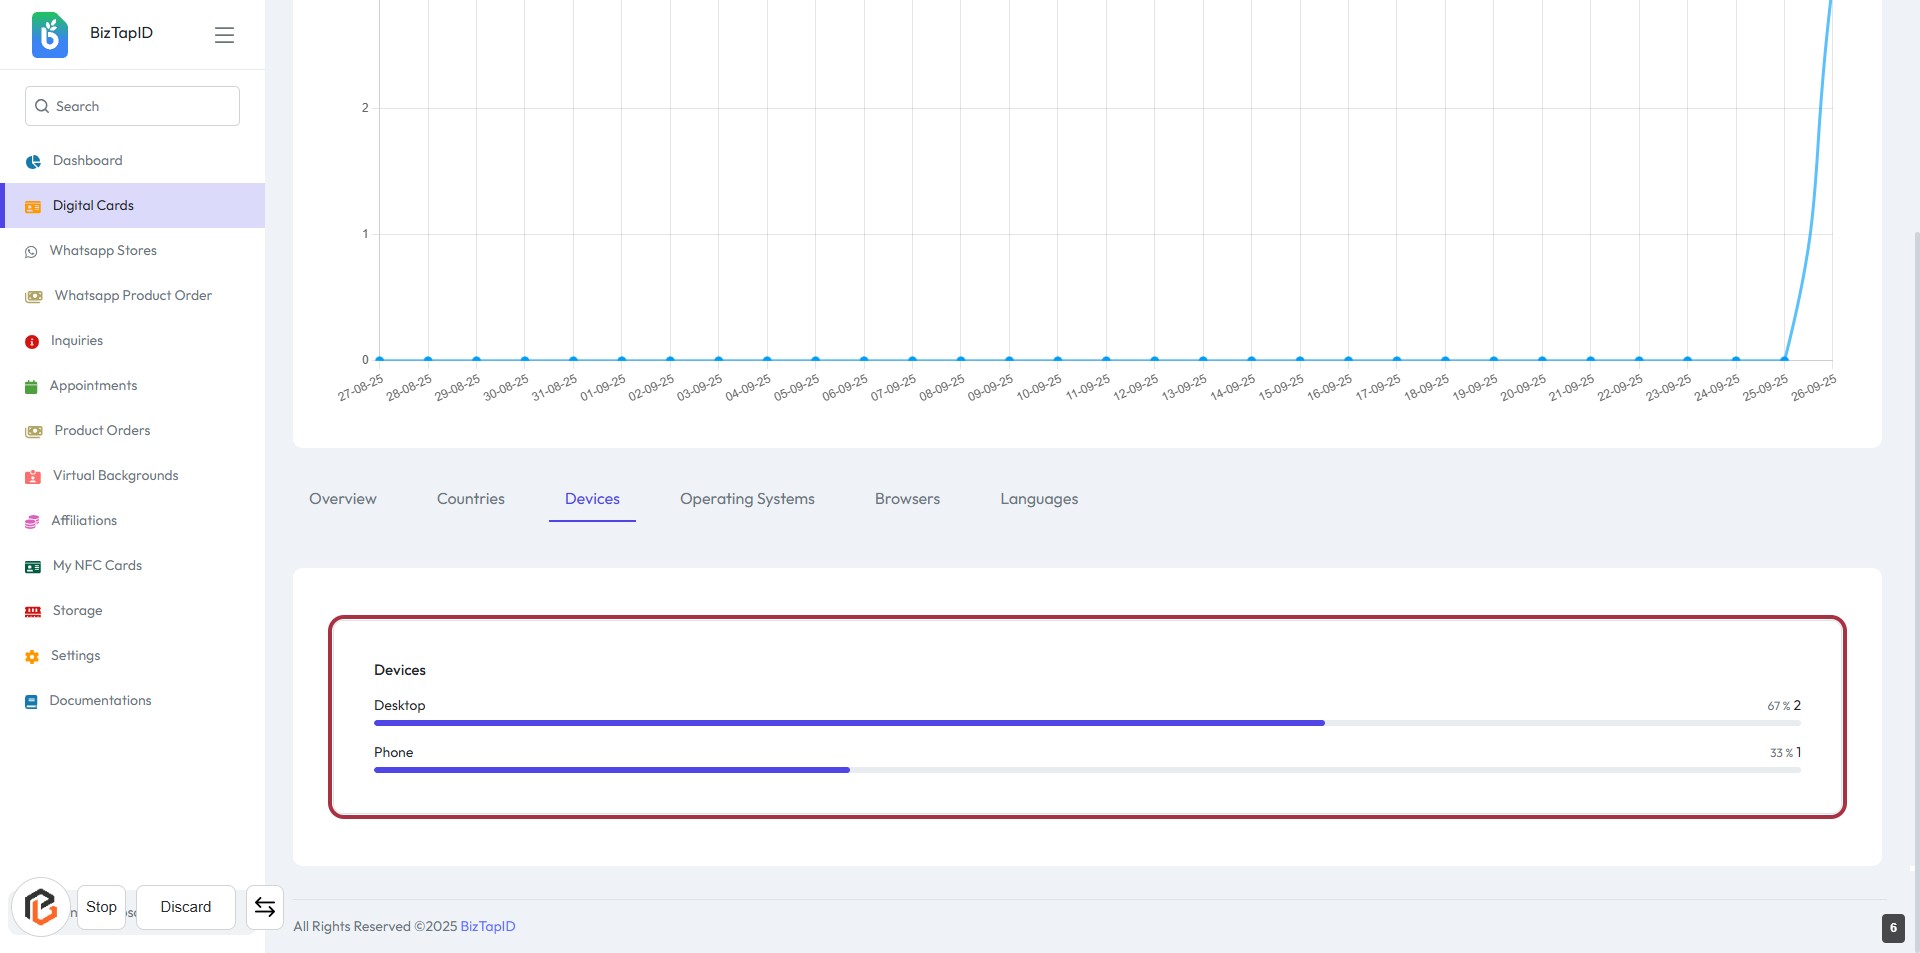
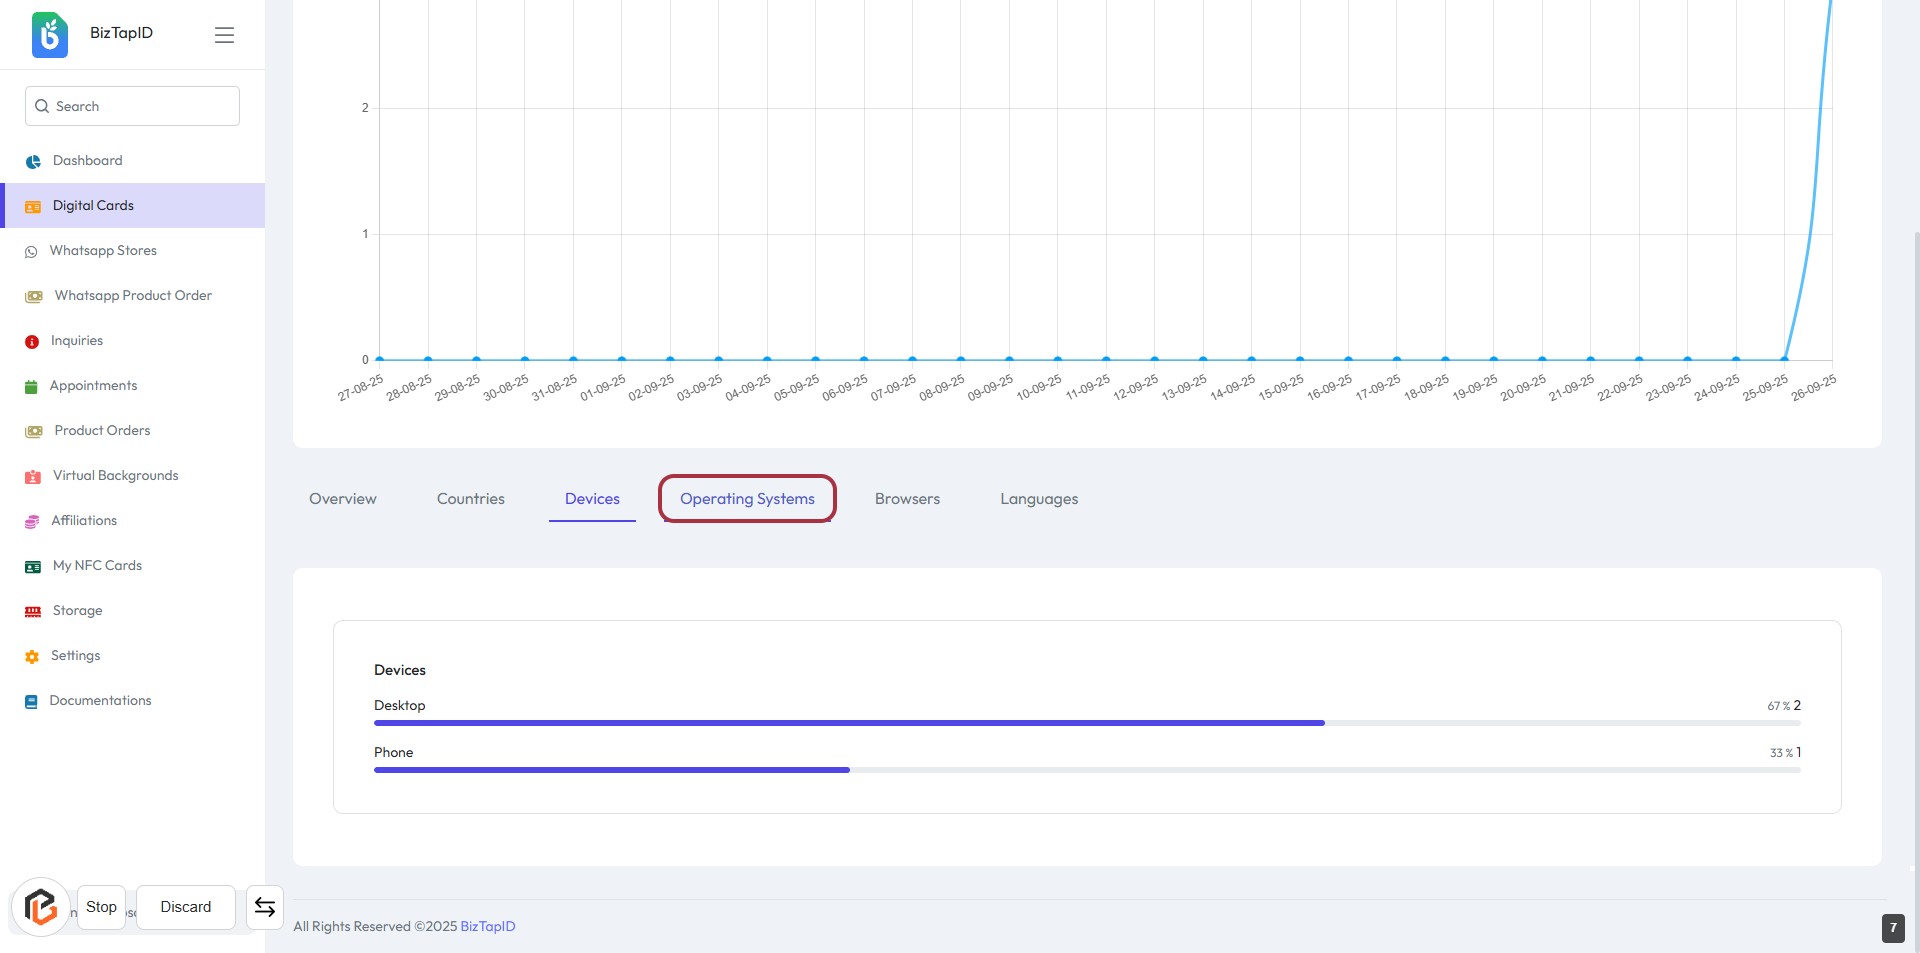
STEP 7: Click on "Devices" to View Device Analytics
- Click on the "Devices" section to access detailed analytics.
- Review the device usage statistics displayed in the highlighted area.
- The data includes usage metrics for "Desktop" and "Phone."
- Ensure to note the values represented by the bars for each device type.
STEP 8: Click on "Operating Systems"
- Navigate to the "Devices" section.
- Click on the "Operating Systems" tab highlighted in red.
- Review the analytics displayed for different operating systems used.
- Ensure to check the data for both Desktop and Phone categories.
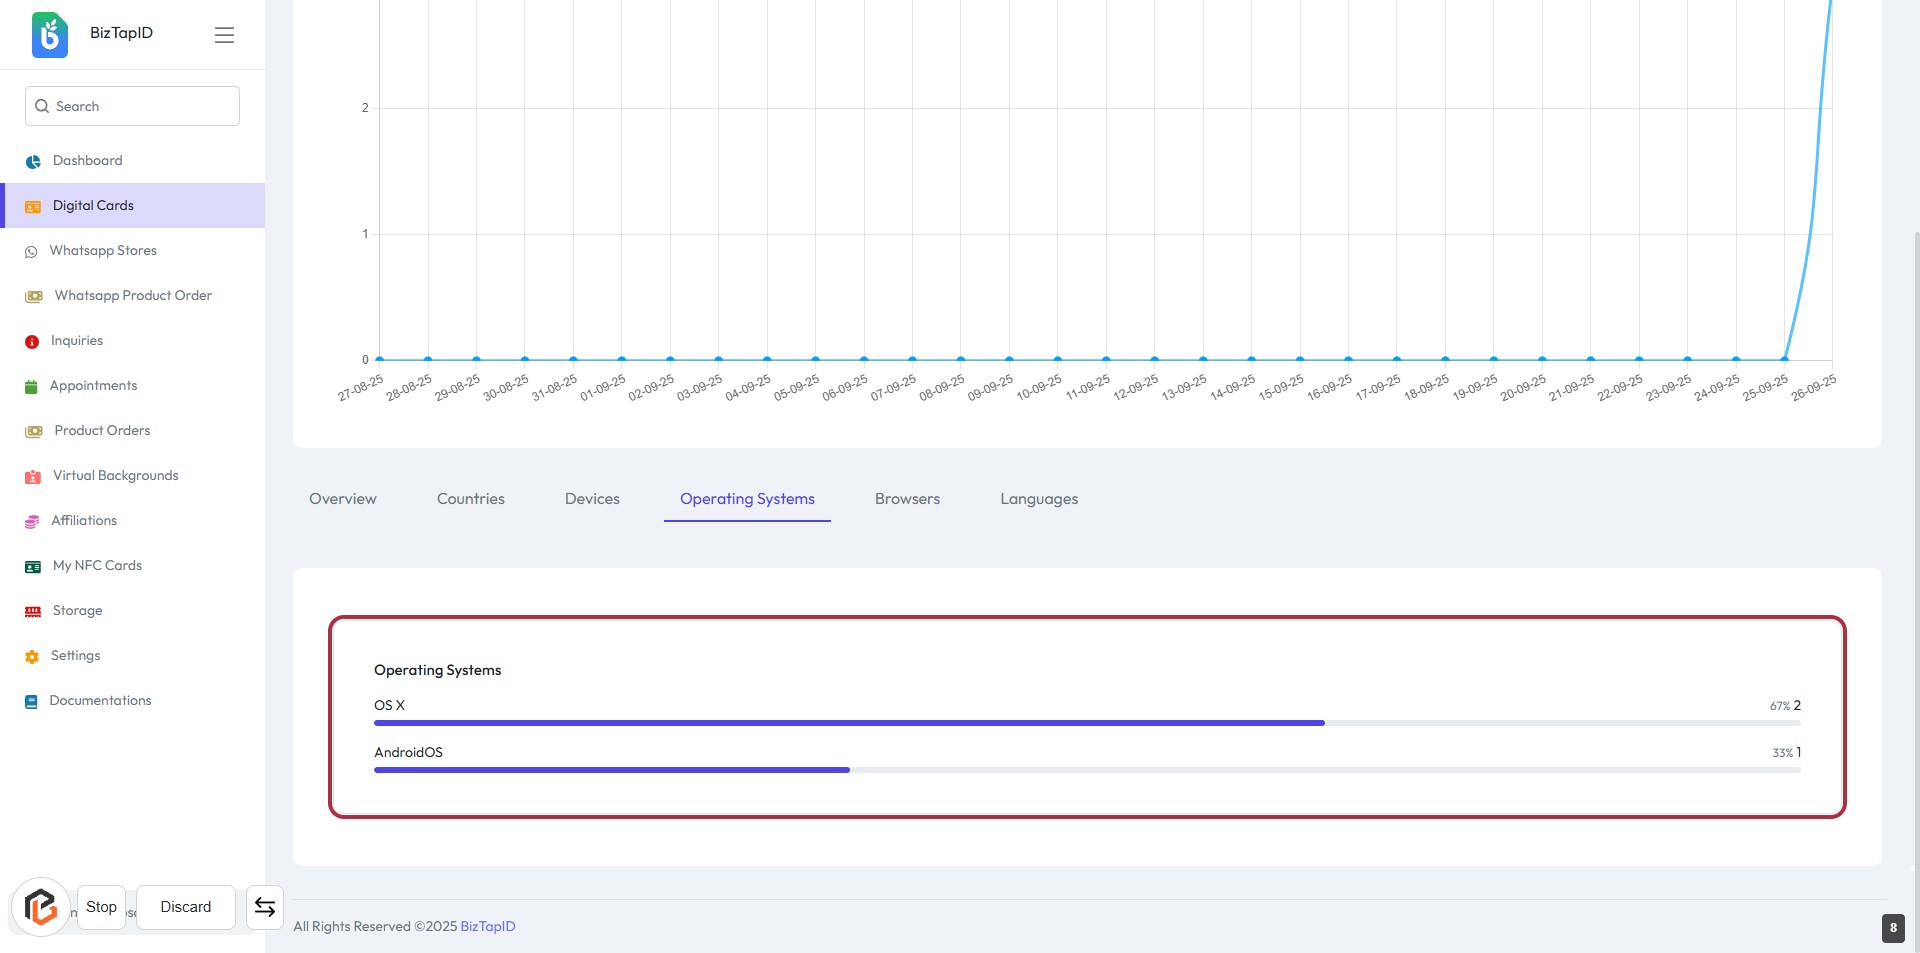
STEP 9: View Operating Systems Data
- Click on the "Operating Systems" section to view analytics.
- The highlighted area displays the operating systems used, including OS X and AndroidOS.
- Each operating system shows its usage percentage and count.
- Review the data for insights into user preferences and trends.
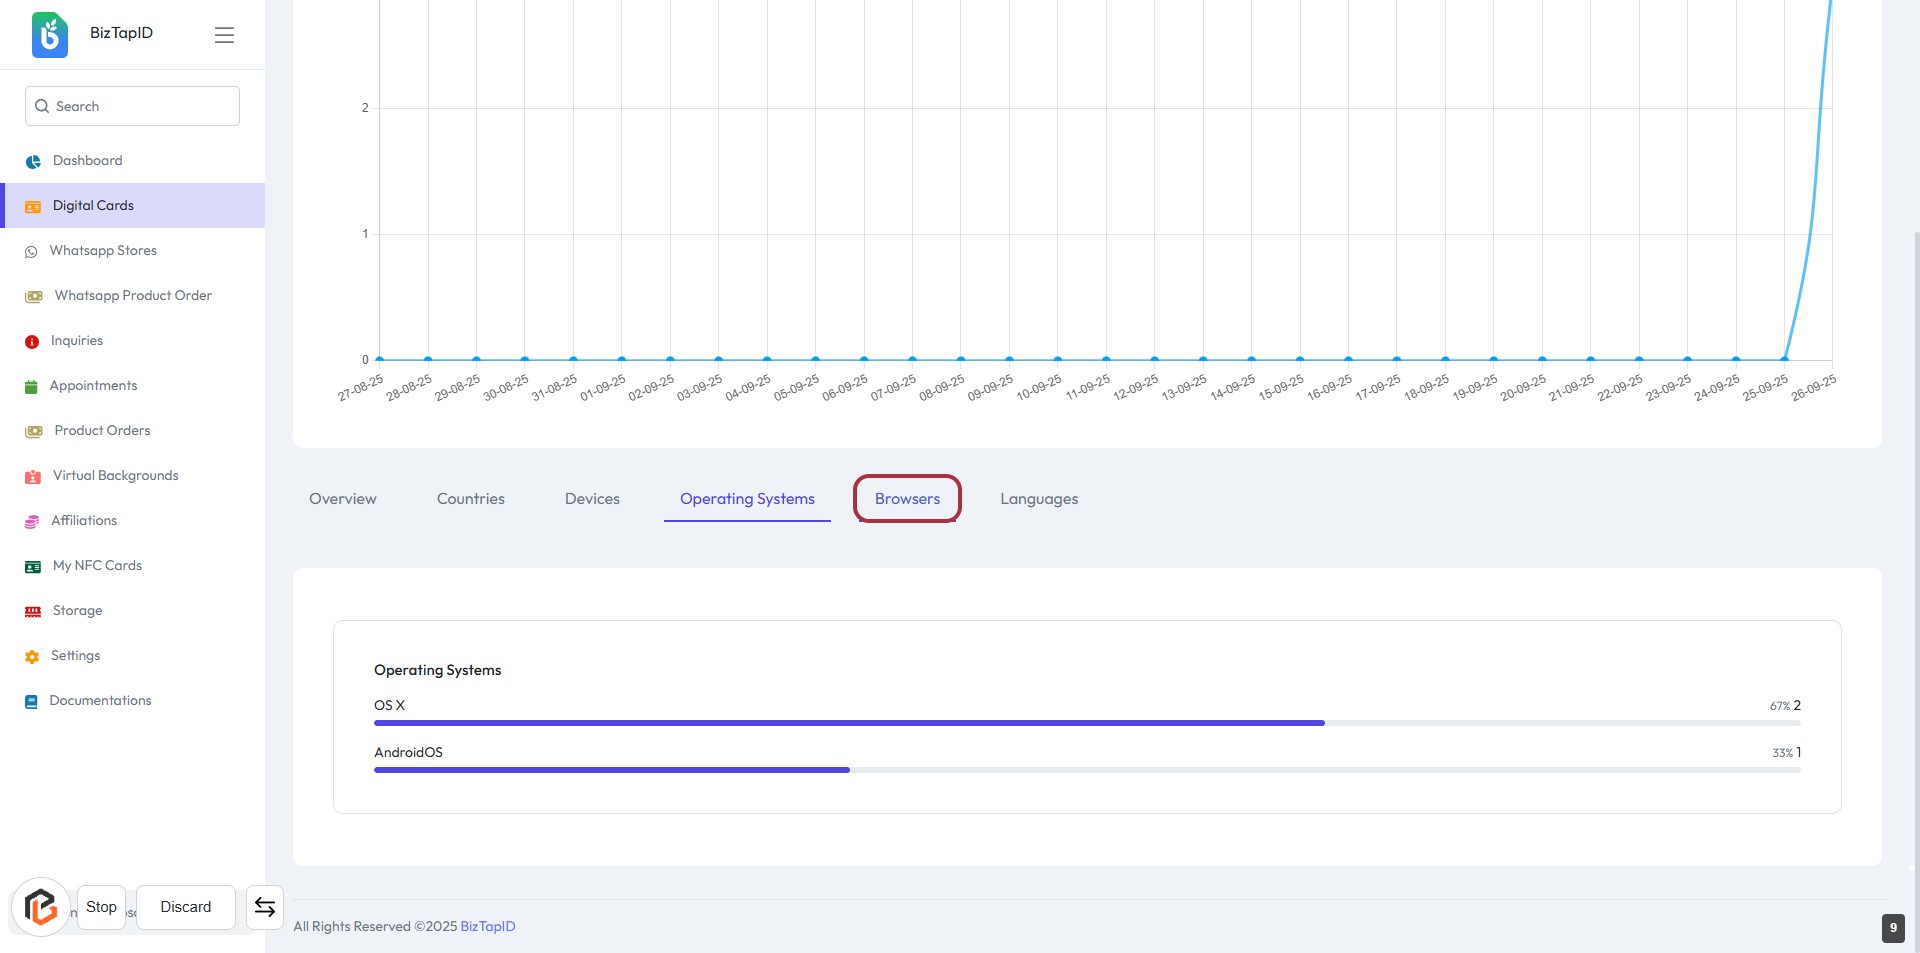
STEP 10: Click on "Browsers"
- Navigate to the "Digital Cards" section.
- Click on the "Browsers" link highlighted in red.
- This will redirect you to the Browsers analytics page.
- Review the displayed data related to browser usage.
- Ensure to check any additional metrics or insights available on this page.
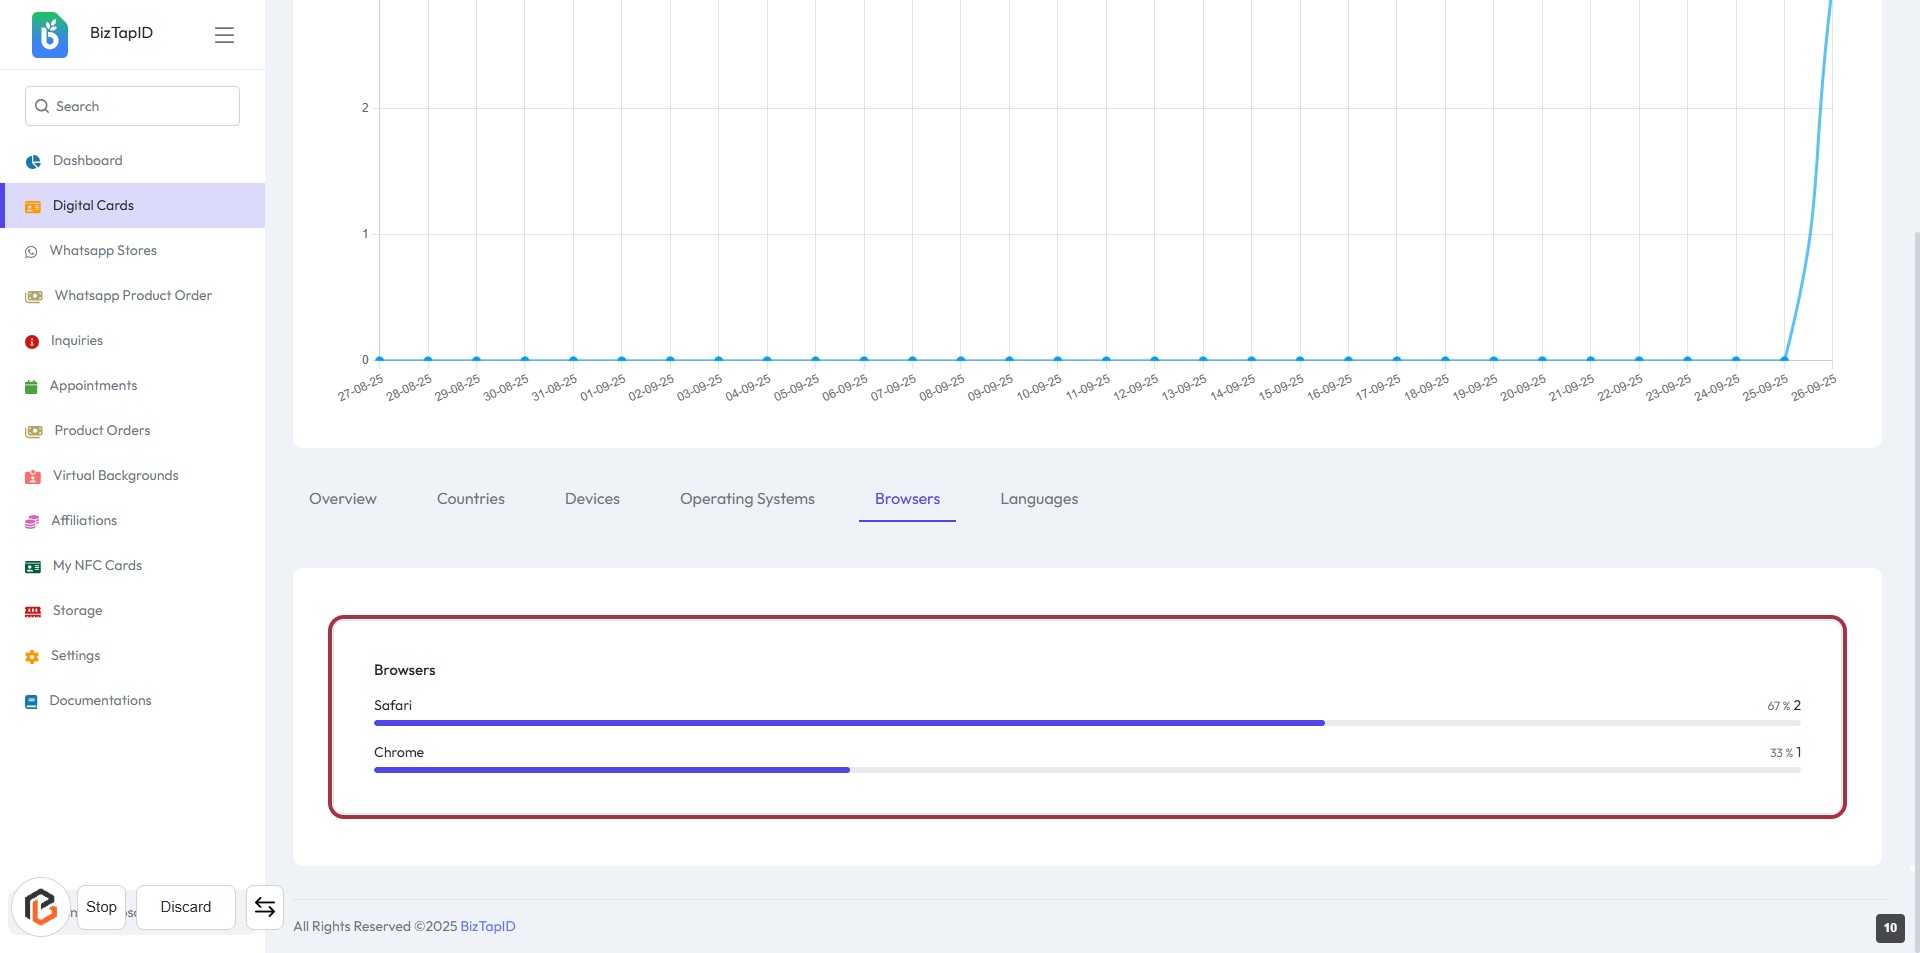
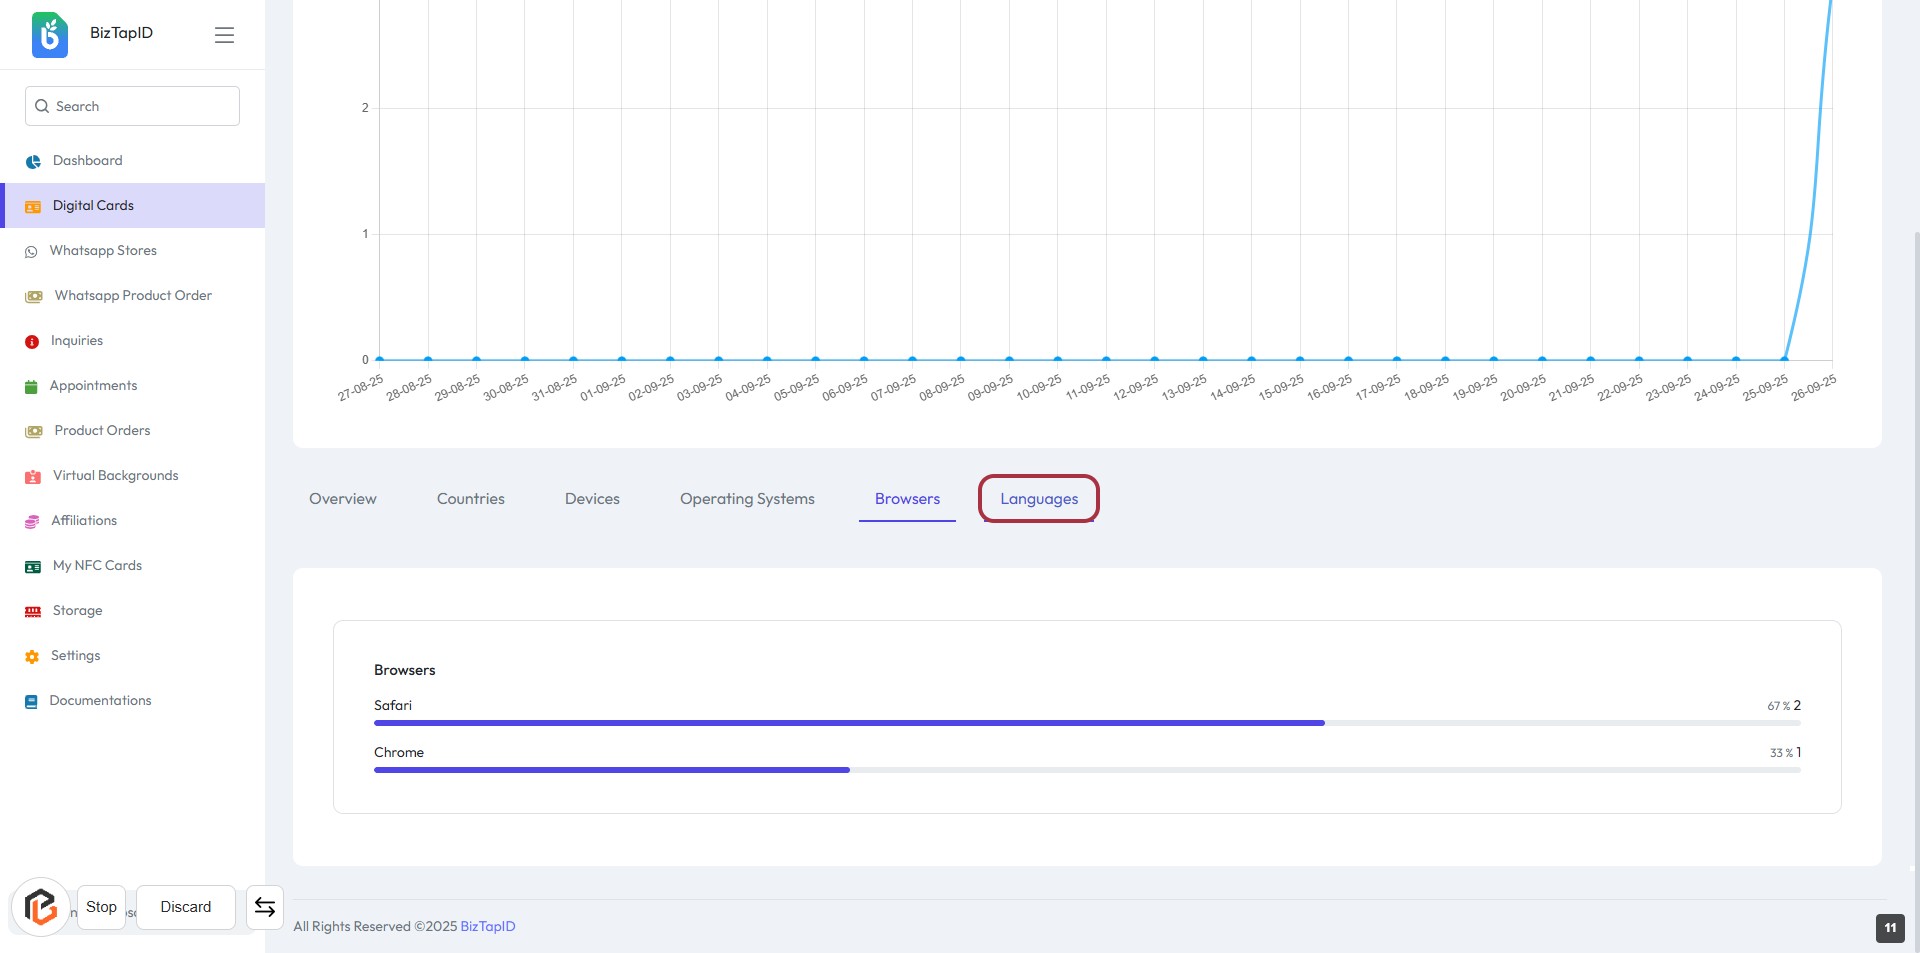
STEP 11: View Browsers Analytics
- Click on the "Browsers" section to view analytics related to browser usage.
- The highlighted area displays the browser names and their respective usage statistics.
- Take note of the data presented for each browser, such as Safari and Chrome.
- Use this information to analyze user preferences and trends.
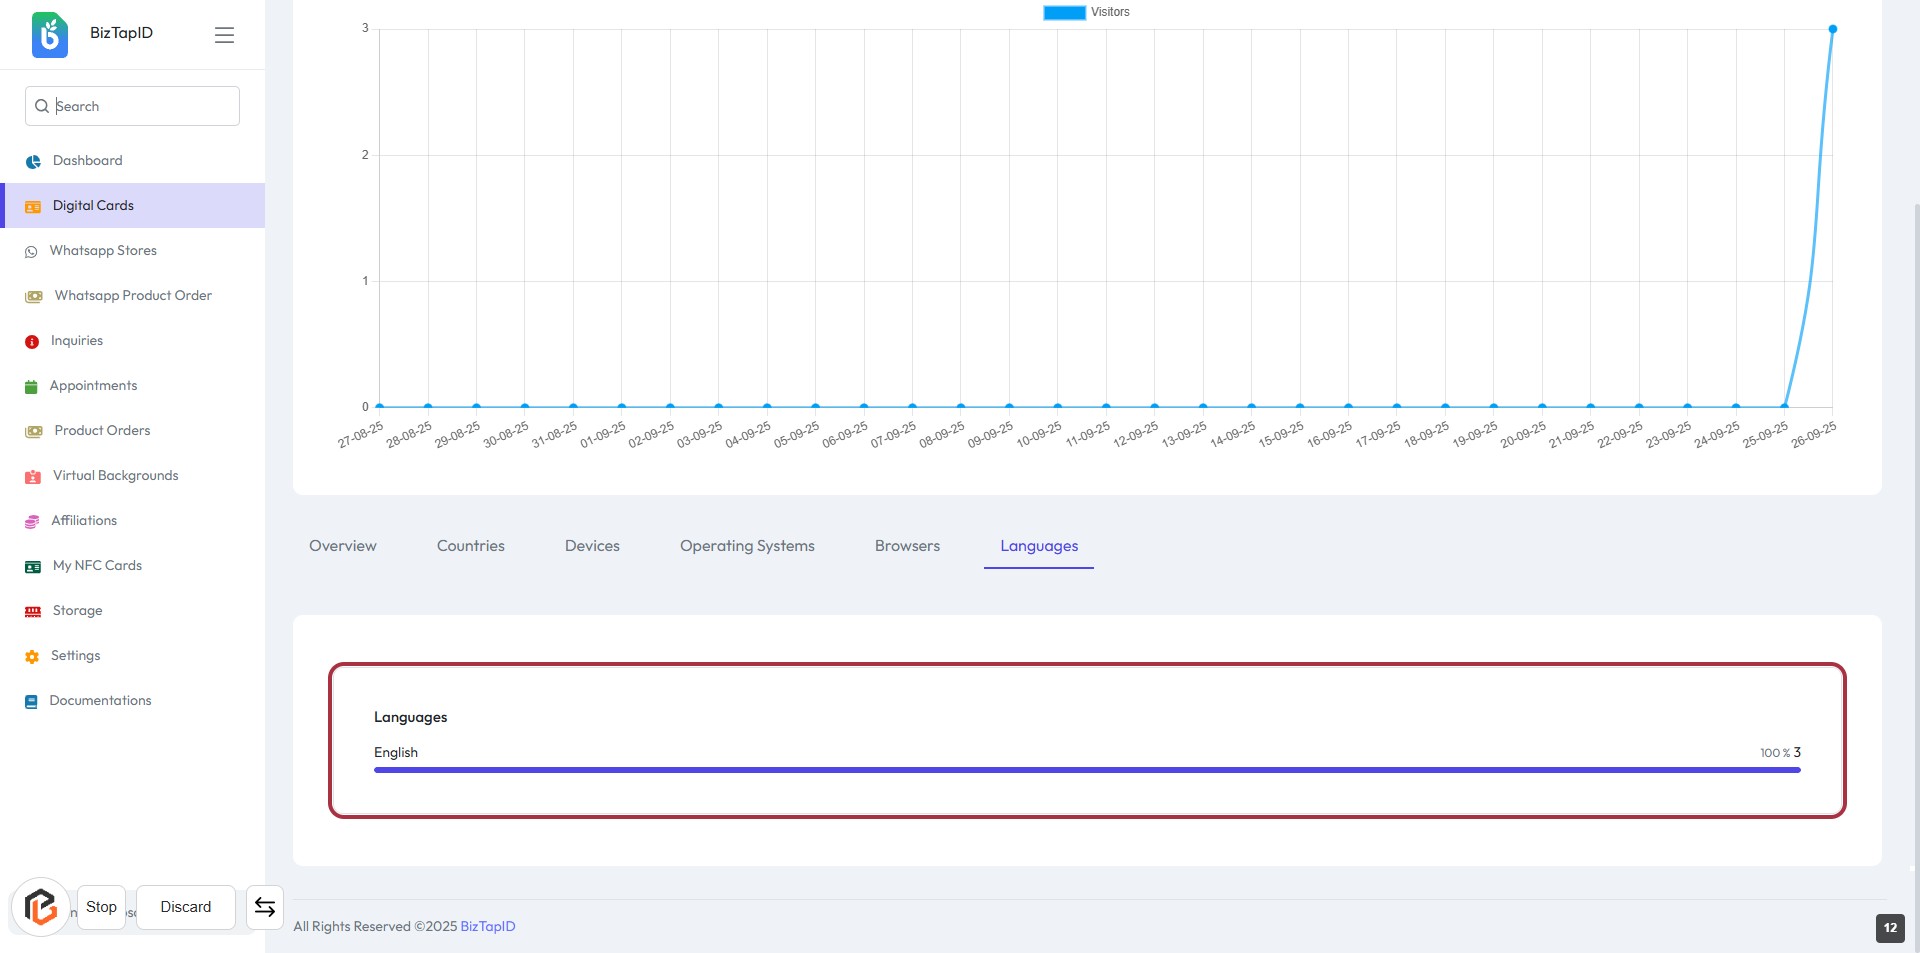
STEP 12: CLICK on "Languages"
- Navigate to the "Languages" tab highlighted in red.
- Click on the "Languages" link to access detailed language analytics.
- Review the displayed data related to user languages.
- Ensure to check for any additional insights or metrics presented on this page.
STEP 13: Click on "Languages" to View Language Analytics
- Navigate to the Languages section to view analytics.
- The highlighted area displays the Languages heading and the specific language (e.g., English).
- Review the analytics data presented below the language details.
- Ensure to check any additional metrics or insights available in this section.
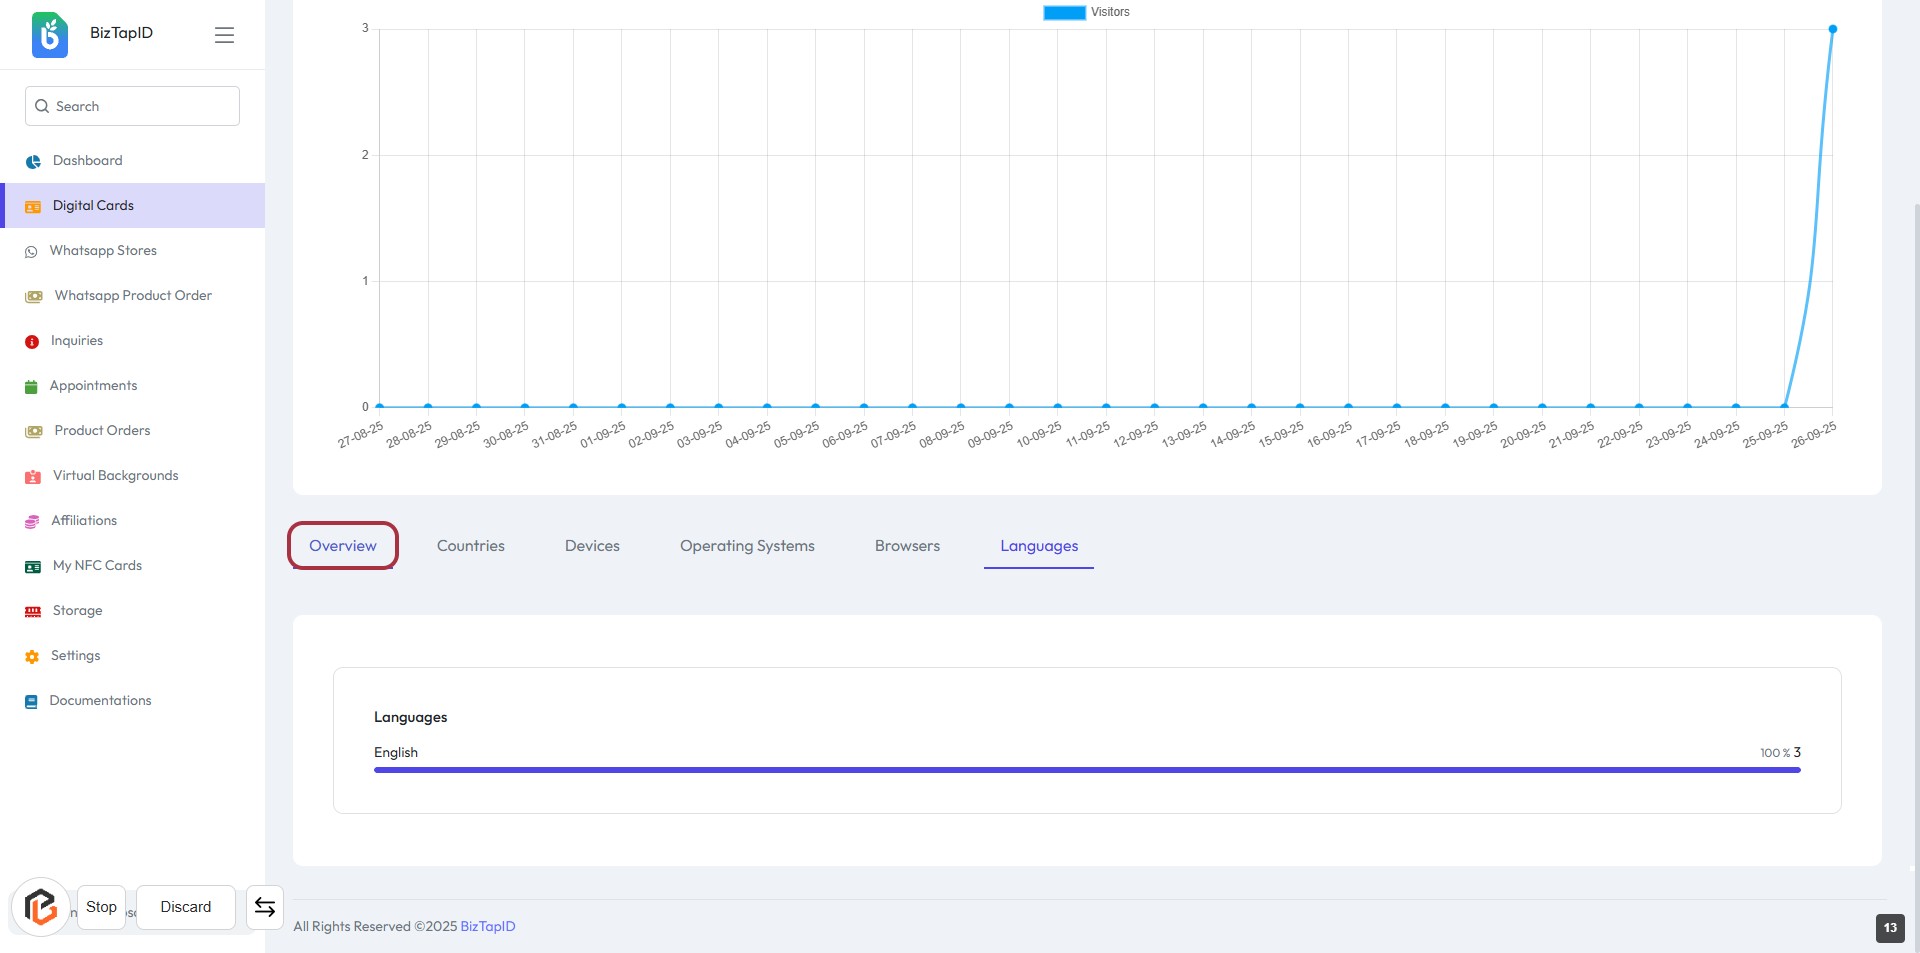
STEP 14: Click on "Overview" to Access Language Analytics
- Navigate to the "Overview" section in the sidebar.
- Click on the "Overview" link to view the analytics context.
- This section provides insights into language usage.
- Ensure to check the highlighted area for specific language metrics.
STEP 15: Click on "Countries" to View Analytics
- Navigate to the highlighted section labeled "Countries."
- Click on the "Countries" box to access detailed analytics.
- Review the data displayed, including country metrics and product views.
- Explore additional insights by clicking "View More Products" if available.